How to Monitor Stamping Line Efficiency in Real Time?
Most stamping plants know their line efficiency only at the end of the month, when the accountant adds up the numbers. By then the lost strokes, the micro-stops, and the slow-speed running are history, and nobody can tell you which one cost the most. Real-time monitoring changes that.
When the press, the NC servo feeder, and the straightener feed their signals into one screen, you can see efficiency drop the moment it happens, identify the cause in minutes, and fix it while the line is still running.
This guide explains which data matters, how to turn it into a reliable OEE number, and how to build a monitoring routine that operators actually use.
You do not need a complete Industry 4.0 platform to start. A modern servo-driven coil line already generates most of the signals you need: the servo drive knows every feed cycle, the press controller knows every stroke, and the straightener knows when material is moving.
The work is connecting those signals, choosing the right metrics, and giving the shift leader a screen that answers one question clearly: is this line making good parts as fast as it should?
Why Efficiency Disappears Without Anyone Noticing
Efficiency rarely collapses in one dramatic failure.
Real-time monitoring makes the invisible visible. The moment a stop exceeds its expected duration, the system flags it. The moment the feeder runs below its set speed, the screen shows it. Shift teams start competing on the number instead of guessing, and the questions change from who is to blame to what is stopping the line.
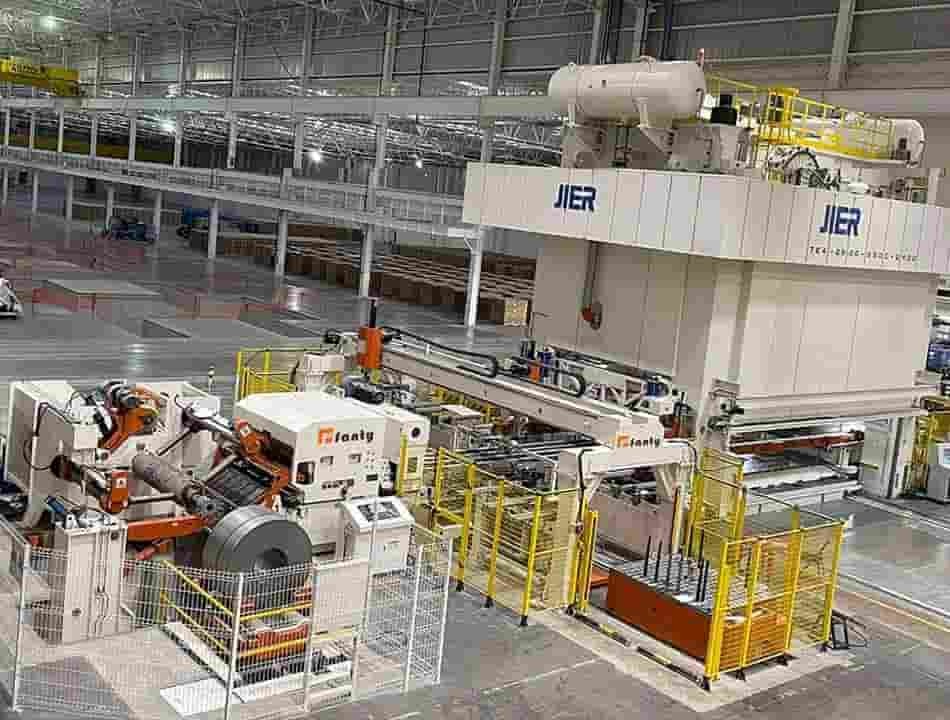 Real-time line monitoring turns hidden losses into visible numbers.
The Five Signals That Tell You Everything
You can monitor hundreds of variables, but five signals carry almost all the useful information on a coil-fed stamping line.
- Press strokes per minute. Compare actual SPM against the programmed SPM for the job; a gap means the line is throttled.
- Feed count and feed length. The servo feeder records every cycle, so the monitor knows exactly how many parts the die has been offered.
- Stop events with duration. Classify each stop as planned or unplanned, and record how long it lasted and why.
- Feeder error codes. Double feeds, pitch errors, and material-end alarms from the servo feeder pinpoint the exact cause of a stop.
- Good-parts count. From a counter at the die exit or the downstream process, so you measure parts out, not strokes made.
With these five signals recorded against a clock, every minute of the shift can be classified. The rest is arithmetic.
How to Calculate OEE That Your Team Trusts
Overall Equipment Effectiveness, or OEE, is the standard way to combine availability, performance, and quality into one number. The formula is simple, but the definitions decide whether the number means anything.
| OEE component | Formula | What it captures on a coil line |
|---|---|---|
| Availability | Run time / planned time | Unplanned stops: feeder jams, die issues, coil changes beyond the standard, breakdowns. |
| Performance | Actual output / theoretical output | Running below programmed SPM, slow feed, micro-stops, and idle gaps. |
| Quality | Good parts / total parts | Scrap, rework, and parts stamped before the die was confirmed good. |
| OEE | Availability x Performance x Quality | A single number between 0 and 100 percent for the whole line. |
World-class OEE for a stamping line is generally considered to be 85 percent or higher. Most well-run plants sit between 60 and 75 percent, which means the average line is giving away a quarter of its capacity to losses that monitoring can expose. Start by measuring, then set a realistic target of five points of improvement in the first quarter.
What a Practical Monitoring Setup Looks Like
You do not need to rip out your existing controls to start monitoring. Three levels of effort match three levels of budget.
At the simplest level, use the counters that already exist. The press controller and the servo feeder both log total strokes and feed cycles; an operator board at the line can record stop reasons on a paper form, and someone enters the data at shift end.
This costs almost nothing and already reveals the big losses, but it depends on operator discipline and gives you yesterday's news.
The middle level connects the press and the NC servo feeder to a small edge computer or PLC that logs signals with timestamps. Stop events are classified automatically by which device raised the alarm, and a simple screen shows the shift leader live availability and the last ten stops.
This level usually costs a few thousand dollars and pays for itself in the first month of reduced downtime.
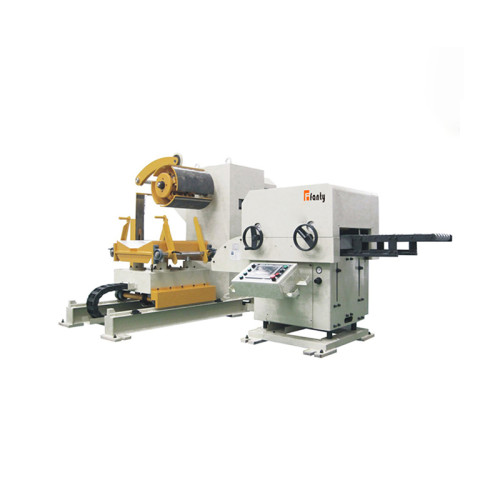
The top level adds quality data, die counters, and an MES or cloud dashboard that compares lines and shifts over months. FANTY installs coil-feeding lines with the signal interfaces for all three levels, so a plant that starts simple can upgrade later without rewiring the feeder.
Turning Alarms into Action
A monitoring system that only records is a diary, not a management tool. The value appears when alarms drive action. Set three rules for your line leaders.
First, respond to long stops immediately. If a stop exceeds ten minutes, the shift leader should be notified and the cause written down before the line restarts, not reconstructed at the end of the day. Second, review the stop Pareto once per shift.
Ten minutes spent looking at the five biggest stops tells you where tomorrow's improvement is. Third, treat repeated short stops as one problem. Five two-minute feeder adjustments are not five events; they are one root cause that needs a fix, and the monitor is what makes the pattern visible.
In plants where this routine runs for a month, the most common finding is that coil changeover and die setup together account for more lost time than breakdowns. That is good news, because changeover time can be attacked with preparation, standardized methods, and better equipment, all of which a clear measurement justifies.
How the NC Servo Feeder Fits into the Data Picture
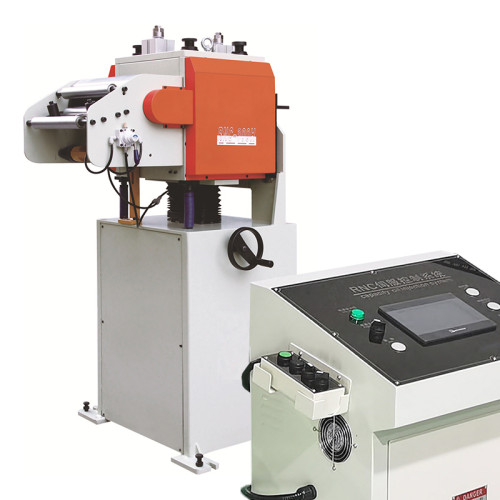
The NC servo feeder is not just a mechanical component of the line; it is the best data source you already own. Every feed cycle is a servo movement with a known target and a measured result.
Feeder data is also honest. A servo drive does not round numbers to make the shift look good, so the numbers it reports are the ground truth for the whole line. Wiring the feeder's ready signal, error output, and cycle counter into your monitoring system gives you a continuous, accurate picture of the material side of the line with almost no extra hardware.
Frequently Asked Questions
How much does a basic real-time monitoring system cost?
A basic setup using existing press and feeder counters with operator-entered stop reasons can cost almost nothing in hardware. A connected system with an edge computer, signal wiring, and a dashboard typically runs from a few hundred to a few thousand dollars depending on the number of machines.
Can I add monitoring to an old press line?
Yes. If the press has a PLC or even simple relay outputs for stroke and fault, those signals can be captured. The NC servo feeder on the line already provides cycle and error signals that are easy to tap into, so older lines can usually be monitored without replacing the feeder.
Which metric should we watch first?
Start with availability, because unplanned stops are the biggest and clearest loss. Once stops are under control, add performance and then quality to build the full OEE picture step by step.
Why does our OEE stay low even when the line looks busy?
Because a line can look busy while running below rated speed or stopping often for short periods. OEE multiplies availability, performance, and quality, so a line that runs at 80 percent of rated speed with frequent short stops will score far below what the eye expects.
Do operators resist being monitored?
They resist being blamed, not being measured. Frame the system as a tool to find machine and process problems, share the data openly with the team, and let the shift that improves the number keep the credit. Plants that do this find operators become the strongest advocates of the monitor.
Related reading
Part of the the coil line guide library — the full library of coil handling, straightening and feeding guides from FANTY.
Build a Coil Line That Can Be Measured and Improved
FANTY servo feeder and straightener packages include the signal interfaces for real-time monitoring, so your next line arrives ready for OEE tracking. Send us your press details and we will propose a coil-feeding configuration with the right data outputs.
Discuss Your Line with an EngineerFanty · NC Straightener Feeder
Still Fighting Strip Memory After Straightening?
Send the strip thickness, material grade and target flatness. We specify roll diameter, roll count and NC feed pitch so the line holds tolerance from the first coil, not the fiftieth.
Get a Free QuoteFANTY Machinery · 13 years on stamping automation · 2,000+ coil lines installed · engineers reply within 24 hours